Rat tumor problem: We have J certain kinds of rat tumor diseases. For each kind of tumor, we test people/animals and among those tested positive. Here we assume that is distrubuted with Binom(, ). Our objective is to approximate for each type of tumor.
In particular we use following binomial hierarchical model where and are observed variables.
Notebook Cell
import matplotlib.pyplot as plt

plt.rcParams["axes.spines.right"] = False
plt.rcParams["axes.spines.top"] = False
plt.rcParams["xtick.labelsize"] = 12
plt.rcParams["ytick.labelsize"] = 12

import pandas as pd

pd.set_option("display.max_rows", 80)
import jax
from datetime import date
rng_key = jax.random.key(int(date.today().strftime("%Y%m%d")))import arviz as az
import jax.numpy as jnp
import numpy as np
import blackjax
import tensorflow_probability.substrates.jax as tfp
tfd = tfp.distributions
tfb = tfp.bijectors
az.rcParams["plot.max_subplots"] = 200Notebook Cell
# index of array is type of tumor and value shows number of total people tested.
group_size = jnp.array(
    [
        20,
        20,
        20,
        20,
        20,
        20,
        20,
        19,
        19,
        19,
        19,
        18,
        18,
        17,
        20,
        20,
        20,
        20,
        19,
        19,
        18,
        18,
        25,
        24,
        23,
        20,
        20,
        20,
        20,
        20,
        20,
        10,
        49,
        19,
        46,
        27,
        17,
        49,
        47,
        20,
        20,
        13,
        48,
        50,
        20,
        20,
        20,
        20,
        20,
        20,
        20,
        48,
        19,
        19,
        19,
        22,
        46,
        49,
        20,
        20,
        23,
        19,
        22,
        20,
        20,
        20,
        52,
        46,
        47,
        24,
        14,
    ],
    dtype=jnp.float32,
)

# index of array is type of tumor and value shows number of positve people.
n_of_positives = jnp.array(
    [
        0,
        0,
        0,
        0,
        0,
        0,
        0,
        0,
        0,
        0,
        0,
        0,
        0,
        0,
        1,
        1,
        1,
        1,
        1,
        1,
        1,
        1,
        2,
        2,
        2,
        2,
        2,
        2,
        2,
        2,
        2,
        1,
        5,
        2,
        5,
        3,
        2,
        7,
        7,
        3,
        3,
        2,
        9,
        10,
        4,
        4,
        4,
        4,
        4,
        4,
        4,
        10,
        4,
        4,
        4,
        5,
        11,
        12,
        5,
        5,
        6,
        5,
        6,
        6,
        6,
        6,
        16,
        15,
        15,
        9,
        4,
    ],
    dtype=jnp.float32,
)

# number of different kind of rat tumors
n_rat_tumors = len(group_size)
Source
_, axes = plt.subplots(2, 1, figsize=(12, 6))
axes[0].bar(range(n_rat_tumors), n_of_positives)
axes[0].set_title("No. of positives for each tumor type", fontsize=14);
axes[1].bar(range(n_rat_tumors), group_size)
axes[1].set_xlabel("tumor type", fontsize=12)
axes[1].set_title("Group size for each tumor type", fontsize=14)
plt.tight_layout();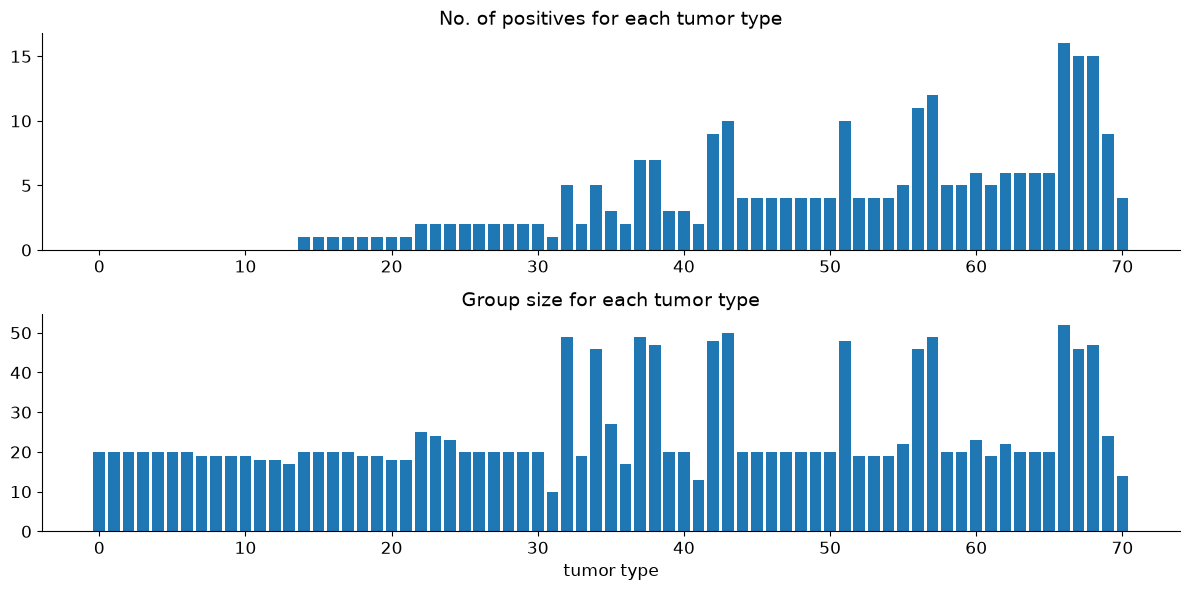
Posterior Sampling
Now we use Blackjax’s NUTS algorithm to get posterior samples of , , and
from collections import namedtuple

params = namedtuple("model_params", ["a", "b", "thetas"])


def joint_logdensity(params):
    # improper prior for a,b
    logdensity_ab = jnp.log(jnp.power(params.a + params.b, -2.5))

    # logdensity prior of theta
    logdensity_thetas = tfd.Beta(params.a, params.b).log_prob(params.thetas).sum()

    # loglikelihood of y
    logdensity_y = jnp.sum(
        tfd.Binomial(group_size, probs=params.thetas).log_prob(n_of_positives)
    )

    return logdensity_ab + logdensity_thetas + logdensity_y
We take initial parameters from uniform distribution
rng_key, init_key = jax.random.split(rng_key)
n_params = n_rat_tumors + 2


def init_param_fn(seed):
    """
    initialize a, b & thetas
    """
    key1, key2, key3 = jax.random.split(seed, 3)
    return params(
        a=tfd.Uniform(0, 3).sample(seed=key1),
        b=tfd.Uniform(0, 3).sample(seed=key2),
        thetas=tfd.Uniform(0, 1).sample(n_rat_tumors, seed=key3),
    )


init_param = init_param_fn(init_key)
joint_logdensity(init_param)  # sanity check
Array(-1145.5424, dtype=float32)Now we use blackjax’s window adaption algorithm to get NUTS kernel and initial states. Window adaption algorithm will automatically configure inverse_mass_matrix and step size
%%time
warmup = blackjax.window_adaptation(blackjax.nuts, joint_logdensity)

# we use 4 chains for sampling
n_chains = 4
rng_key, init_key, warmup_key = jax.random.split(rng_key, 3)
init_keys = jax.random.split(init_key, n_chains)
init_params = jax.vmap(init_param_fn)(init_keys)

@jax.vmap
def call_warmup(seed, param):
    (initial_states, tuned_params), _ = warmup.run(seed, param, 1000)
    return initial_states, tuned_params

warmup_keys = jax.random.split(warmup_key, n_chains)
initial_states, tuned_params = jax.jit(call_warmup)(warmup_keys, init_params)
CPU times: user 9.29 s, sys: 214 ms, total: 9.5 s
Wall time: 6.93 s
Now we write inference loop for multiple chains
def inference_loop_multiple_chains(
    rng_key, initial_states, tuned_params, log_prob_fn, num_samples, num_chains
):
    kernel = blackjax.nuts.build_kernel()

    def step_fn(key, state, **params):
        return kernel(key, state, log_prob_fn, **params)

    def one_step(states, rng_key):
        keys = jax.random.split(rng_key, num_chains)
        states, infos = jax.vmap(step_fn)(keys, states, **tuned_params)
        return states, (states, infos)

    keys = jax.random.split(rng_key, num_samples)
    _, (states, infos) = jax.lax.scan(one_step, initial_states, keys)

    return (states, infos)
%%time
n_samples = 1000
rng_key, sample_key = jax.random.split(rng_key)
states, infos = inference_loop_multiple_chains(
sample_key, initial_states, tuned_params, joint_logdensity, n_samples, n_chains
)CPU times: user 8.7 s, sys: 86 ms, total: 8.78 s
Wall time: 6.16 s
Arviz Plots
We have all our posterior samples stored in states.position dictionary and infos store additional information like acceptance probability, divergence, etc. Now, we can use certain diagnostics to judge if our MCMC samples are converged on stationary distribution. Some of widely diagnostics are trace plots, potential scale reduction factor (R hat), divergences, etc. Arviz library provides quicker ways to anaylze these diagnostics. We can use arviz.summary() and arviz_plot_trace(), but these functions take specific format (arviz’s trace) as a input.
Notebook Cell
def arviz_trace_from_states(states, info, burn_in=0):
position = states.position
if isinstance(position, jax.Array): # if states.position is array of samples
position = dict(samples=position)
else:
try:
position = position._asdict()
except AttributeError:
pass
samples = {}
for param in position.keys():
ndims = len(position[param].shape)
if ndims >= 2:
samples[param] = np.asarray(jnp.swapaxes(position[param], 0, 1)[
:, burn_in:
]) # swap n_samples and n_chains
divergence = np.asarray(jnp.swapaxes(info.is_divergent[burn_in:], 0, 1))
if ndims == 1:
divergence = np.asarray(info.is_divergent)
samples[param] = np.asarray(position[param])
trace = az.from_dict({"posterior": samples, "sample_stats": {"diverging": divergence}})
return trace# make arviz trace from states
trace = arviz_trace_from_states(states, infos)
summ_df = az.summary(trace)
summ_dfr_hat is showing measure of each chain is converged to stationary distribution. r_hat should be less than or equal to 1.01, here we get r_hat far from 1.01 for each latent sample.
Source
az.plot_trace(trace)
plt.tight_layout();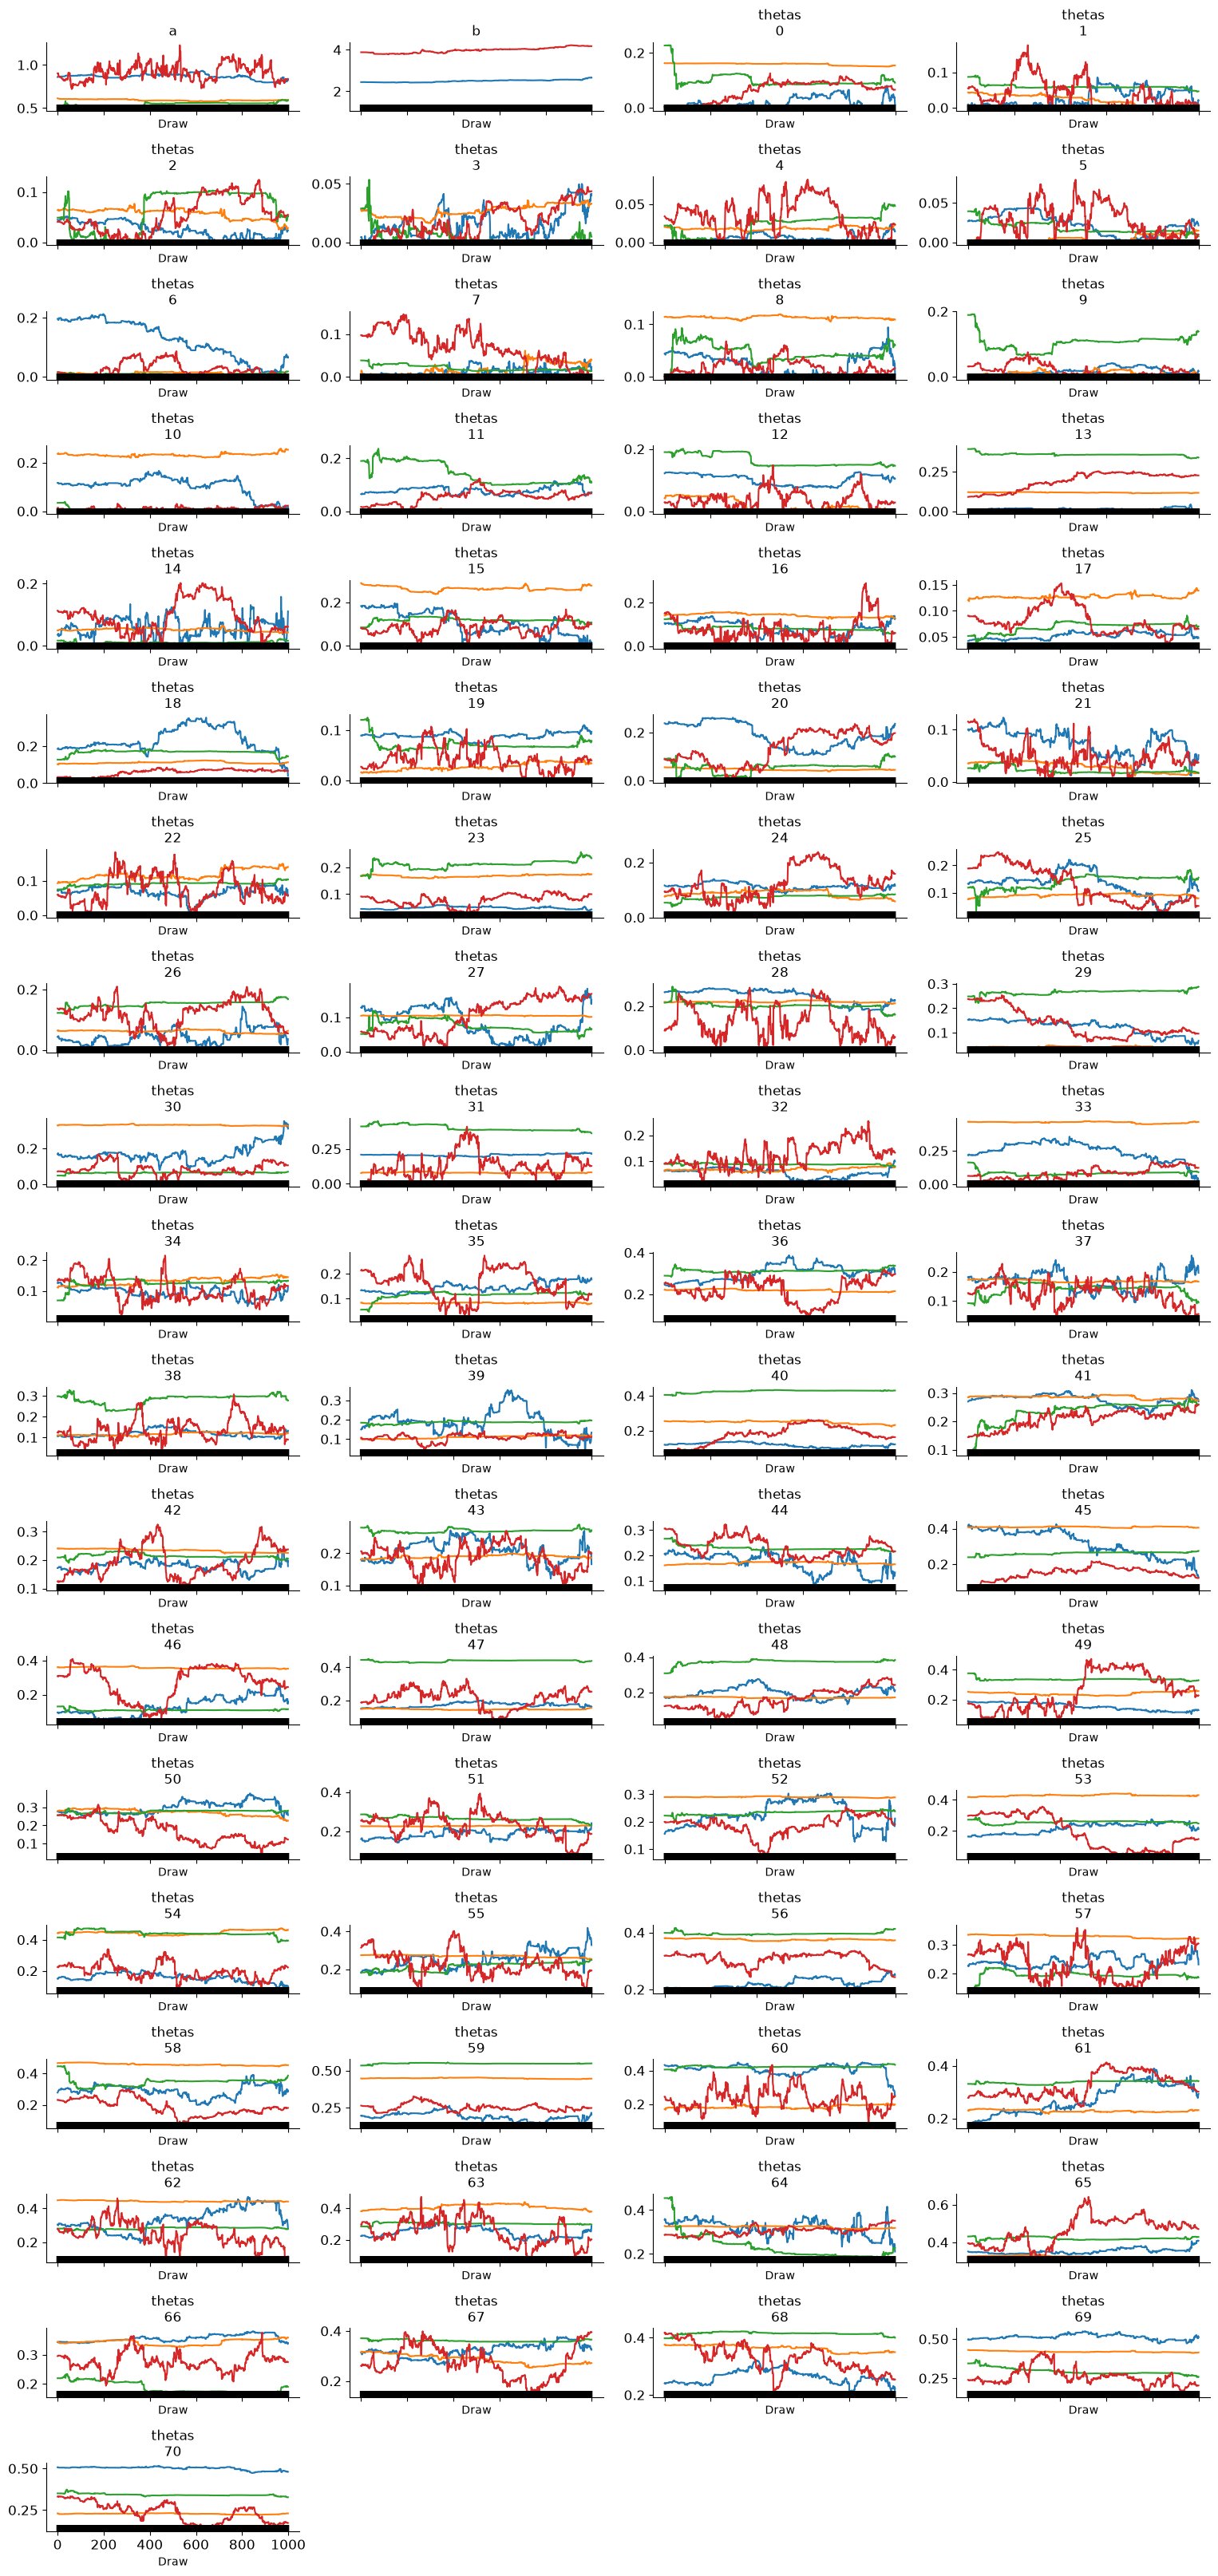
Trace plots also looks terrible and does not seems to be converged! Also, black band shows that every sample is diverged from original distribution. So what’s wrong happeing here?
Well, it’s related to support of latent variable. In HMC, the latent variable must be in an unconstrained space, but in above model theta is constrained in between 0 to 1. We can use change of variable trick to solve above problem
Change of Variable
We can sample from logits which is in unconstrained space and in joint_logdensity() we can convert logits to theta by suitable bijector (sigmoid). We calculate jacobian (first order derivaive) of bijector to tranform one probability distribution to another
transform_fn = jax.nn.sigmoid
log_jacobian_fn = lambda logit: jnp.log(jnp.abs(jnp.diag(jax.jacfwd(transform_fn)(logit))))Alternatively, using the bijector class in TFP directly:
bij = tfb.Sigmoid()
transform_fn = bij.forward
log_jacobian_fn = bij.forward_log_det_jacobianparams = namedtuple("model_params", ["a", "b", "logits"])
def joint_logdensity_change_of_var(params):
# change of variable
thetas = transform_fn(params.logits)
log_det_jacob = jnp.sum(log_jacobian_fn(params.logits))
# improper prior for a,b
logdensity_ab = jnp.log(jnp.power(params.a + params.b, -2.5))
# logdensity prior of theta
logdensity_thetas = tfd.Beta(params.a, params.b).log_prob(thetas).sum()
# loglikelihood of y
logdensity_y = jnp.sum(
tfd.Binomial(group_size, probs=thetas).log_prob(n_of_positives)
)
return logdensity_ab + logdensity_thetas + logdensity_y + log_det_jacobexcept for the change of variable in joint_logdensity() function, everthing will remain same
rng_key, init_key = jax.random.split(rng_key)
def init_param_fn(seed):
"""
initialize a, b & logits
"""
key1, key2, key3 = jax.random.split(seed, 3)
return params(
a=tfd.Uniform(0, 3).sample(seed=key1),
b=tfd.Uniform(0, 3).sample(seed=key2),
logits=tfd.Uniform(-2, 2).sample(n_rat_tumors, key3),
)
init_param = init_param_fn(init_key)
joint_logdensity_change_of_var(init_param) # sanity checkArray(-1085.318, dtype=float32)%%time
warmup = blackjax.window_adaptation(blackjax.nuts, joint_logdensity_change_of_var)
# we use 4 chains for sampling
n_chains = 4
rng_key, init_key, warmup_key = jax.random.split(rng_key, 3)
init_keys = jax.random.split(init_key, n_chains)
init_params = jax.vmap(init_param_fn)(init_keys)
@jax.vmap
def call_warmup(seed, param):
(initial_states, tuned_params), _ = warmup.run(seed, param, 1000)
return initial_states, tuned_params
warmup_keys = jax.random.split(warmup_key, n_chains)
initial_states, tuned_params = call_warmup(warmup_keys, init_params)CPU times: user 12.9 s, sys: 177 ms, total: 13.1 s
Wall time: 9.09 s
%%time
n_samples = 1000
rng_key, sample_key = jax.random.split(rng_key)
states, infos = inference_loop_multiple_chains(
sample_key, initial_states, tuned_params, joint_logdensity_change_of_var, n_samples, n_chains
)CPU times: user 9.77 s, sys: 49.4 ms, total: 9.82 s
Wall time: 5.05 s
# convert logits samples to theta samples
position = states.position._asdict()
position["thetas"] = jax.nn.sigmoid(position["logits"])
del position["logits"] # delete logits
states = states._replace(position=position)# make arviz trace from states
trace = arviz_trace_from_states(states, infos, burn_in=0)
summ_df = az.summary(trace)
summ_dfSource
az.plot_trace(trace)
plt.tight_layout();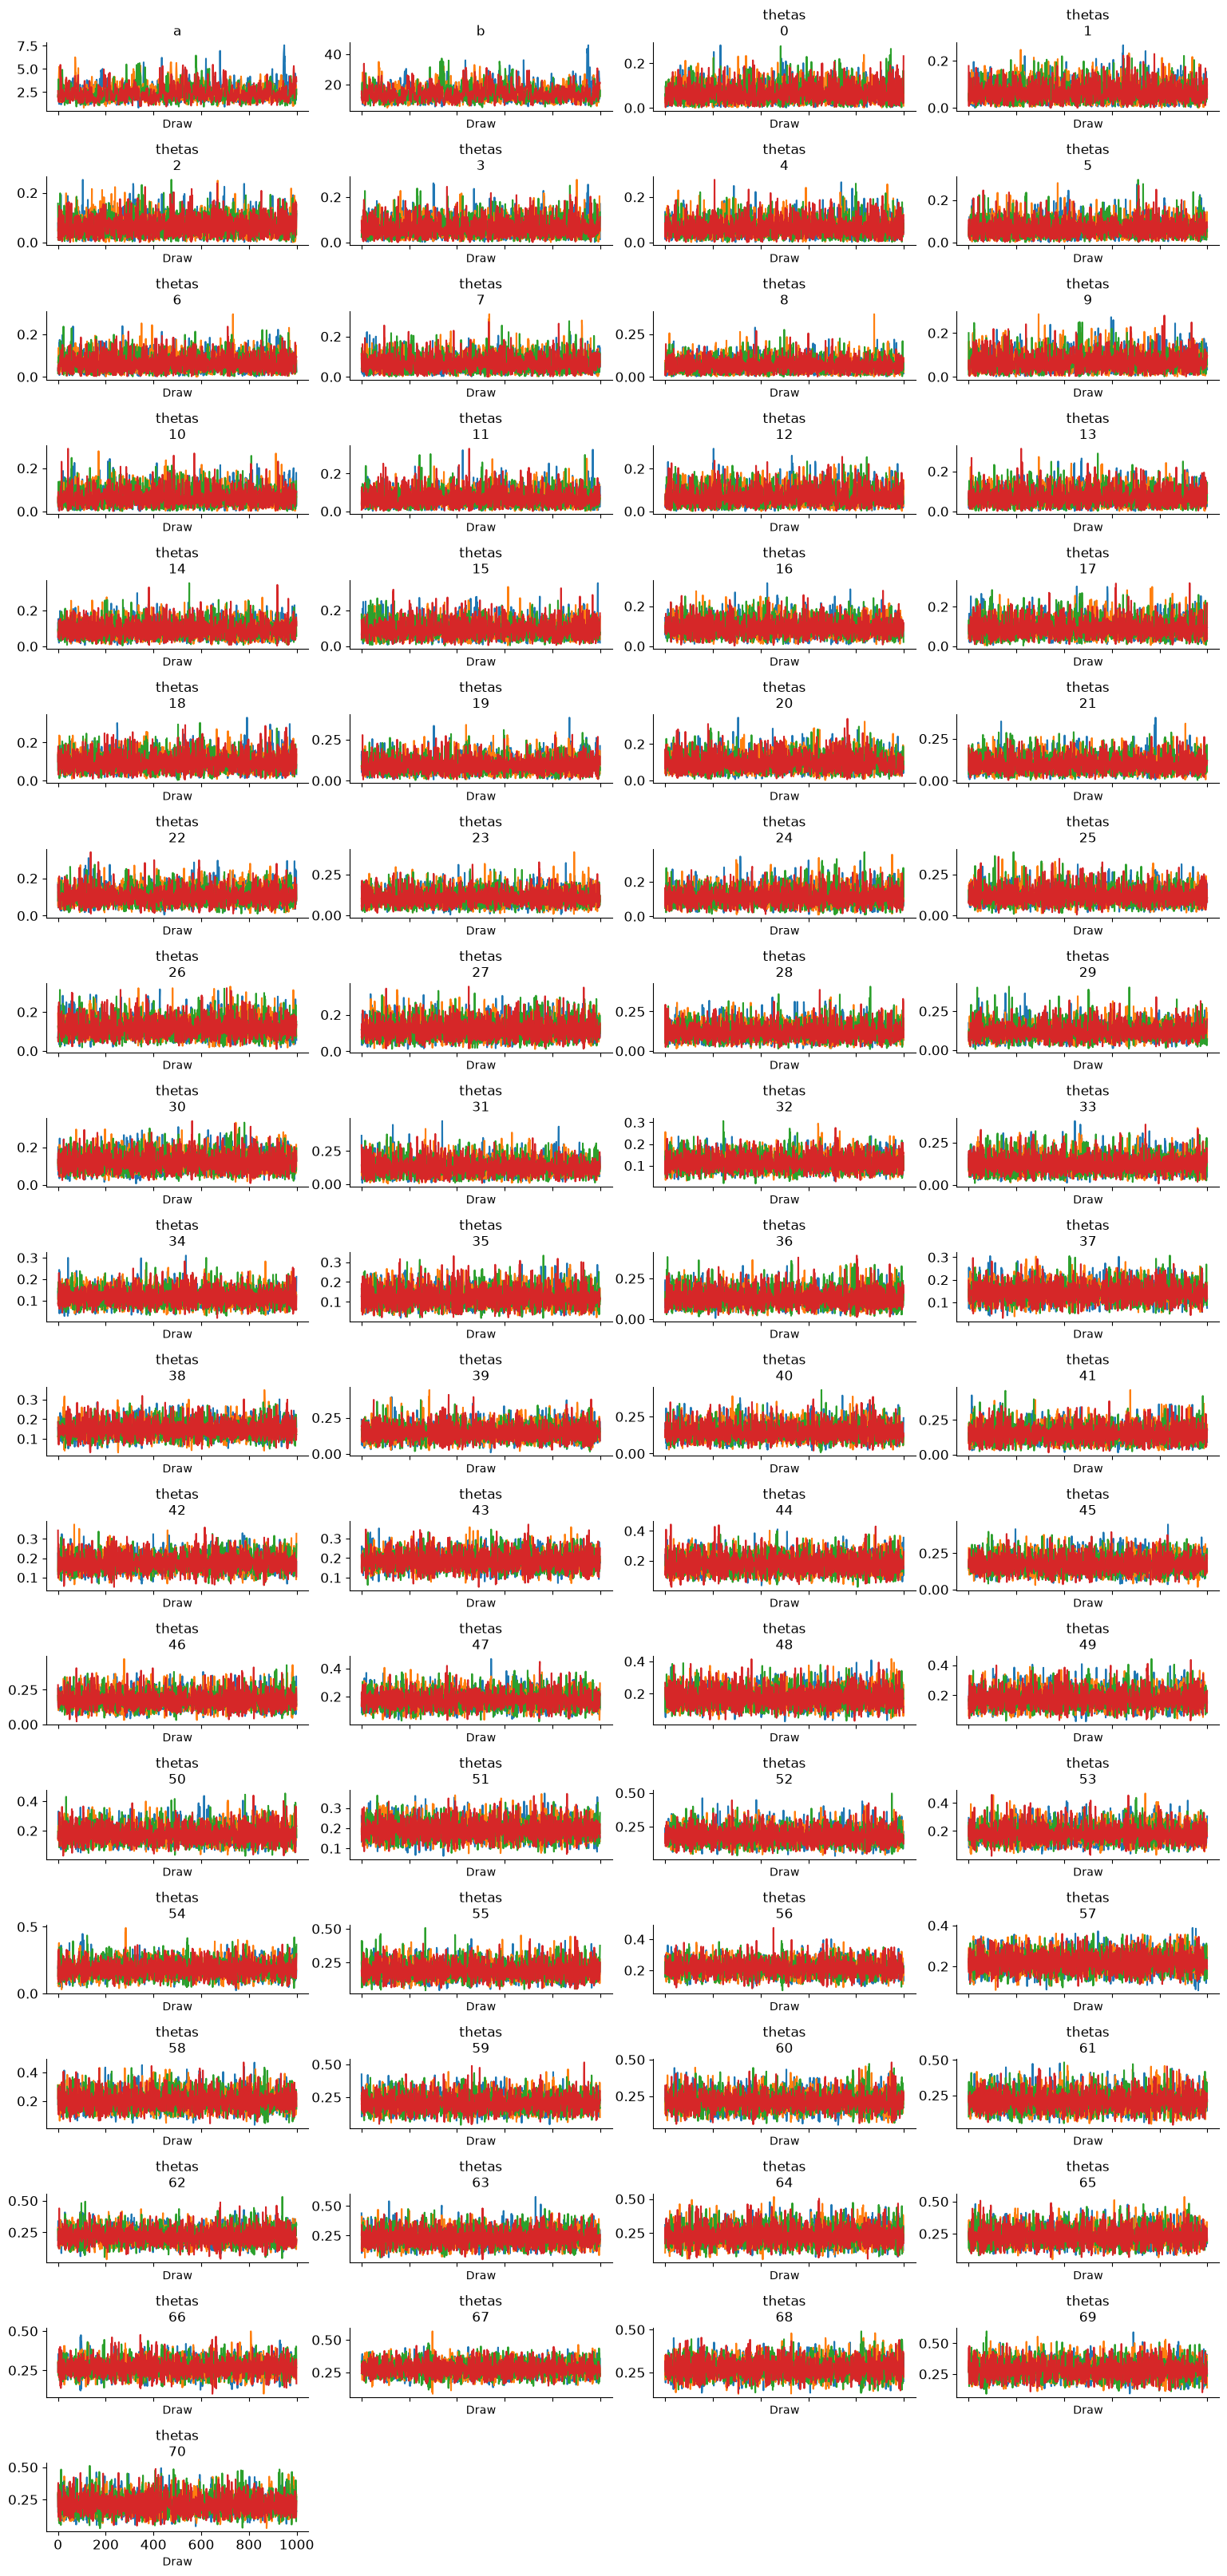
print(f"Number of divergence: {infos.is_divergent.sum()}")Number of divergence: 0
We can see that r_hat is less than or equal to 1.01 for each latent variable, trace plots looks converged to stationary distribution, and only few samples are diverged.
Using a PPL
Probabilistic programming language usually provides functionality to apply change of variable easily (often done automatically). In this case for TFP, we can use its modeling API tfd.JointDistribution*.
tfed = tfp.experimental.distributions
@tfd.JointDistributionCoroutineAutoBatched
def model():
# TFP does not have improper prior, use uninformative prior instead
a = yield tfd.HalfCauchy(0, 100, name='a')
b = yield tfd.HalfCauchy(0, 100, name='b')
yield tfed.IncrementLogProb(jnp.log(jnp.power(a + b, -2.5)), name='logdensity_ab')
thetas = yield tfd.Sample(tfd.Beta(a, b), n_rat_tumors, name='thetas')
yield tfd.Binomial(group_size, probs=thetas, name='y')
# Sample from the prior and prior predictive distributions. The result is a pytree.
# model.sample(seed=rng_key)# Condition on the observed (and auxiliary variable).
pinned = model.experimental_pin(logdensity_ab=(), y=n_of_positives)
# Get the default change of variable bijectors from the model
bijectors = pinned.experimental_default_event_space_bijector()
rng_key, init_key = jax.random.split(rng_key)
prior_sample = pinned.sample_unpinned(seed=init_key)
# You can check the unbounded sample
# bijectors.inverse(prior_sample)def joint_logdensity(unbound_param):
param = bijectors.forward(unbound_param)
log_det_jacobian = bijectors.forward_log_det_jacobian(unbound_param)
return pinned.unnormalized_log_prob(param) + log_det_jacobian%%time
warmup = blackjax.window_adaptation(blackjax.nuts, joint_logdensity)
# we use 4 chains for sampling
n_chains = 4
rng_key, init_key, warmup_key = jax.random.split(rng_key, 3)
init_params = bijectors.inverse(pinned.sample_unpinned(n_chains, seed=init_key))
@jax.vmap
def call_warmup(seed, param):
(initial_states, tuned_params), _ = warmup.run(seed, param, 1000)
return initial_states, tuned_params
warmup_keys = jax.random.split(warmup_key, n_chains)
initial_states, tuned_params = call_warmup(warmup_keys, init_params)CPU times: user 17.6 s, sys: 152 ms, total: 17.8 s
Wall time: 11.9 s
%%time
n_samples = 1000
rng_key, sample_key = jax.random.split(rng_key)
states, infos = inference_loop_multiple_chains(
    sample_key, initial_states, tuned_params, joint_logdensity, n_samples, n_chains
)
CPU times: user 11.2 s, sys: 35.8 ms, total: 11.3 s
Wall time: 5.51 s
# convert logits samples to theta samples
position = states.position
states = states._replace(position=bijectors.forward(position))# make arviz trace from states
trace = arviz_trace_from_states(states, infos, burn_in=0)
summ_df = az.summary(trace)
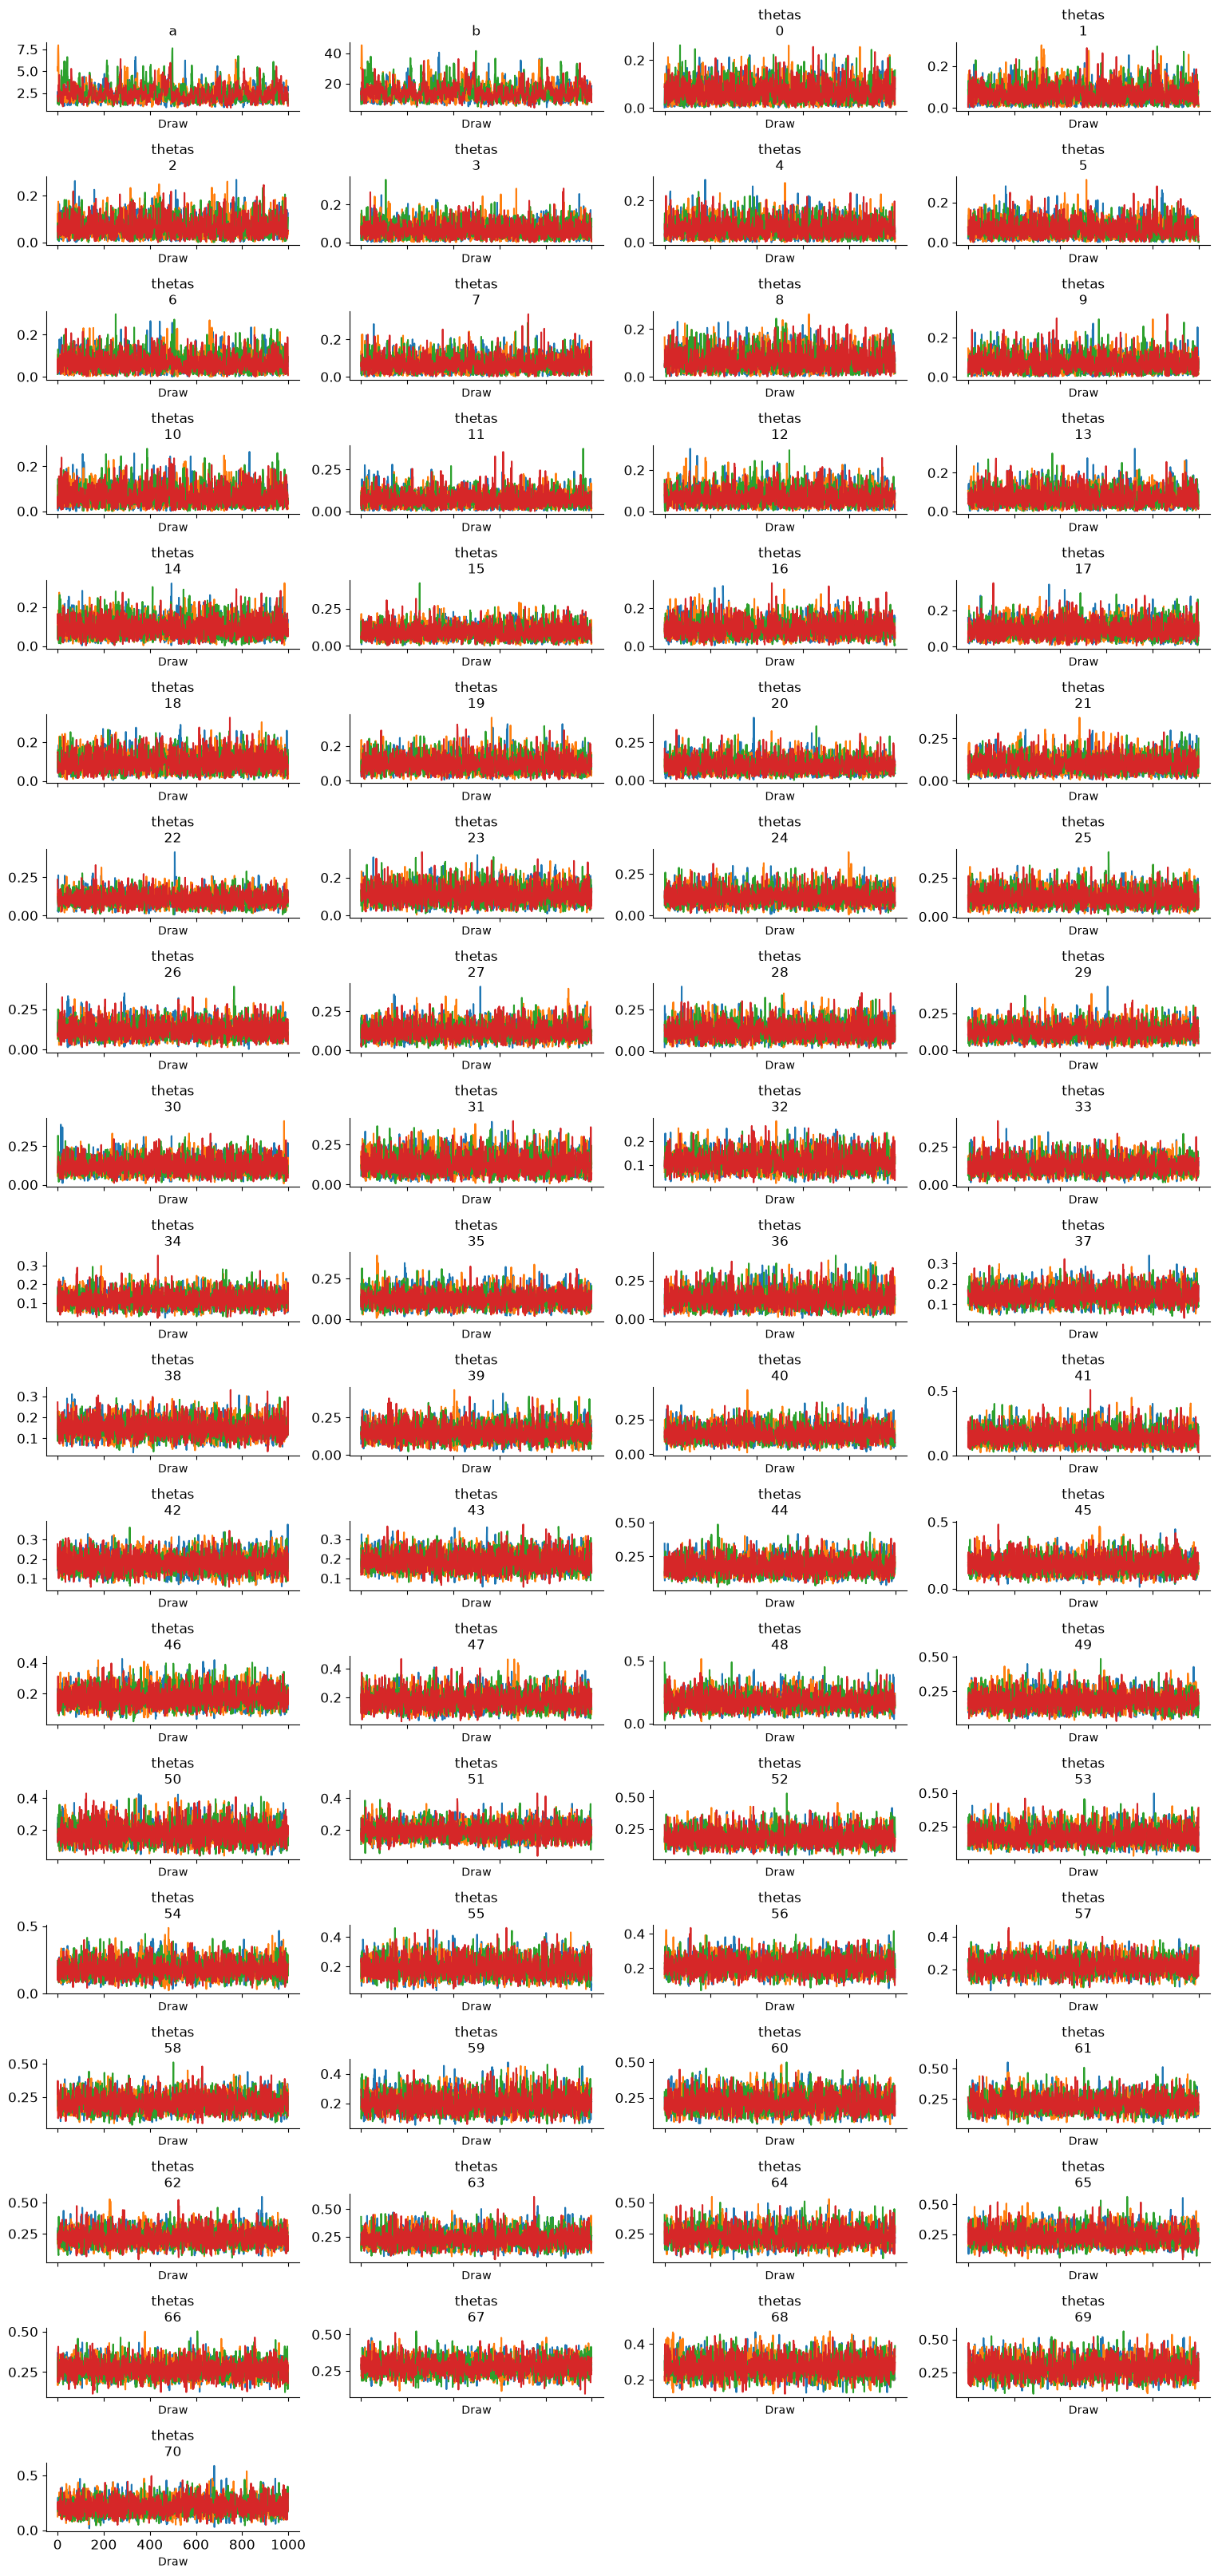
summ_dfSource
az.plot_trace(trace)
plt.tight_layout();